MASS DATA - Google AI for Marketers

Looker Studio vs Power BI for Marketing Reporting

Explore Looker Studio vs Power BI marketing tools for data reporting. Discover which platform best suits your needs.

When it comes to looker studio vs power bi marketing, choosing the right tool can significantly impact your marketing strategies. Both platforms offer unique features for data visualization and reporting, making them popular choices among marketing professionals. However, understanding their differences is crucial for maximizing your marketing insights.
Key Takeaways
Looker Studio excels in connecting to Google data sources and building custom dashboards.
Power BI offers advanced visualization tools and collaboration features.
Both platforms have unique strengths that cater to different marketing needs.
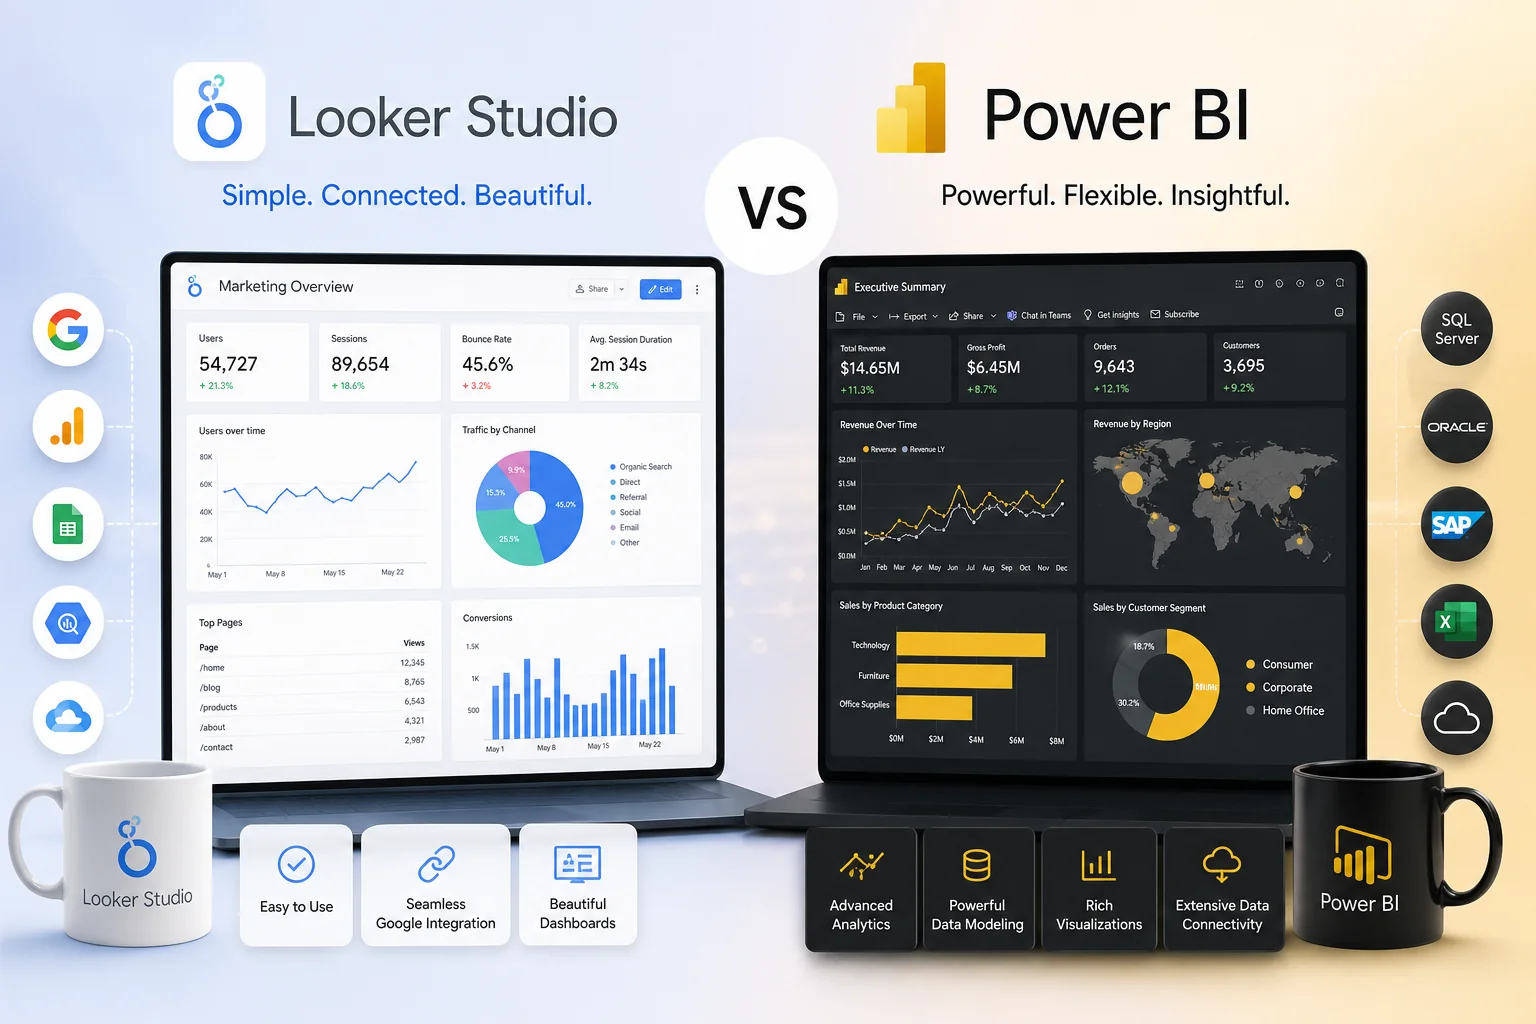
Digital illustration contrasting Looker Studio's vibrant dashboard with Power BI's sleek analytics, set against a dynamic gra

Understanding Looker Studio and
Power BI for Marketing Reporting

Core Features of Looker Studio

Looker Studio, previously known as Google Data Studio, is designed to help marketing professionals visualize data effortlessly. Its core features include:

  • Data Connectors: Looker Studio supports a variety of data sources, including Google Ads and Google Analytics. This allows users to pull data seamlessly for comprehensive reporting.
  • Custom Dashboards: Users can create tailored dashboards that focus on key performance indicators (KPIs) relevant to their marketing strategies. The drag-and-drop interface simplifies this process.
  • Collaboration Tools: Looker Studio enables teams to share reports and dashboards easily, facilitating real-time collaboration on marketing insights.
  • Explorative Analysis: Users can drill down into data, exploring different segments to uncover valuable insights. This capability is essential for optimizing campaigns and ad performance.

Core Features of Power BI

Power BI, developed by Microsoft, is another powerful tool for marketing reporting. Its key features include:

  • Robust Data Integration: Power BI excels in connecting to a wide range of data sources, including CRM systems and various databases. This integration is vital for marketers looking for a holistic view of their performance.
  • Interactive Visualizations: The platform offers a rich selection of visual tools, enabling marketers to create engaging and informative reports. Users can easily customize visuals to fit their branding.
  • Advanced Analytics: Power BI provides analytics features that help users explore their data and surface trends and insights.
  • Collaboration and Sharing: With built-in sharing options, Power BI facilitates teamwork by allowing users to publish reports and dashboards that can be accessed by stakeholders across the organization.

In the debate of Looker Studio vs Power BI for marketing reporting, both platforms offer unique strengths that cater to different needs and preferences among marketing professionals.

Key Differences
in Data Visualization

Visualization Capabilities of Looker Studio

Looker Studio offers a flexible and intuitive interface for creating visualizations tailored to marketing needs. Users can craft custom dashboards using a wide array of charts, graphs, and maps, which are particularly useful for displaying campaign performance and ad spend. The platform excels in connecting to various data sources, enabling marketers to visualize data from Google Ads, social media platforms, and CRM systems seamlessly.

  • Customization: Looker Studio allows users to personalize reports with specific metrics, colors, and layout options, ensuring visualizations align with brand identity.
  • Interactivity: Users can create interactive elements, such as filters and date range selectors, enhancing the user experience and allowing for deeper data exploration.
  • Collaboration: The platform facilitates teamwork by allowing multiple users to edit and share reports in real time, making it easier to derive insights collaboratively.

Visualization Capabilities of Power BI

Power BI, a tool from Microsoft, is known for its robust visualization capabilities and extensive integration options. It provides a rich set of visual elements, including bar charts, pie charts, and maps, which can be utilized effectively for marketing analytics.

  • Advanced Analytics: Power BI offers analytics features that help users identify trends in their data, which can be useful for optimizing marketing strategies.
  • Data Modeling: The platform allows for complex data modeling, which helps marketers create sophisticated visualizations that can reflect deep insights into customer behavior and campaign effectiveness.
  • Sharing and Distribution: Power BI offers streamlined options for sharing dashboards with stakeholders, ensuring that everyone has access to the latest marketing performance data.

In summary, while Looker Studio focuses on user-friendly customization and real-time collaboration, Power BI shines with its advanced analytics and data modeling capabilities - each serving distinct needs in the realm of marketing reporting.

Data Integration Capabilities in
Looker Studio vs Power BI
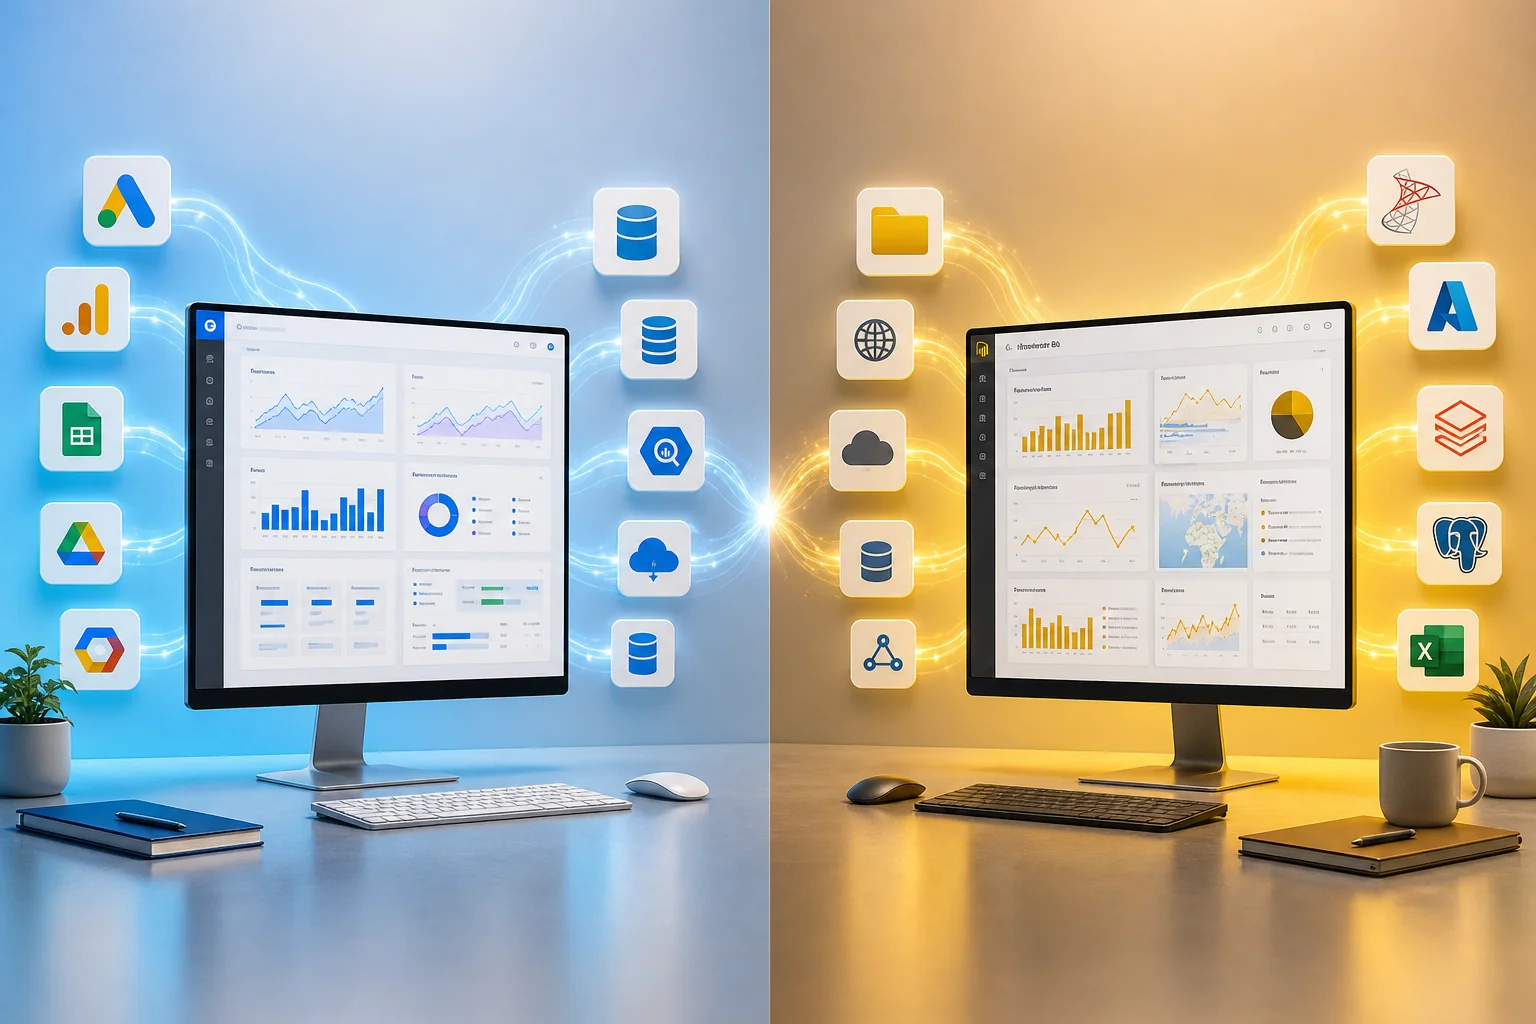
Digital illustration contrasting Looker Studio and Power BI, showcasing their data integration capabilities with vibrant colo

Supported Data Sources in Looker Studio

Looker Studio offers a variety of data connectors that facilitate seamless integration with different marketing platforms. This includes popular sources such as Google Ads, Google Analytics, and various SQL databases. Users can easily pull data from these sources to create comprehensive reports. Looker Studio connects to a range of data sources that marketing teams commonly rely on. This flexibility is vital for marketing professionals who need to analyze data from multiple channels to optimize their strategies.

Supported Data Sources in Power BI

Power BI boasts extensive data integration capabilities, allowing connections to a wide range of sources. This includes a range of cloud-based services and on-premises databases. This broad compatibility makes Power BI a versatile choice for marketers who utilize various tools and platforms.

Real-Time Data Processing: A
Critical Feature for Marketers

How Looker Studio Handles Real-Time Data

Looker Studio excels in its ability to connect to various data sources quickly. It utilizes data connectors that allow marketers to pull in live data from platforms like Google Ads and social media seamlessly. This feature enables real-time visualization of campaign performance metrics. For instance, marketers can adjust ad strategies on the fly based on the latest engagement data. Additionally, Looker Studio’s dashboards can automatically refresh to reflect current data, making it easier for teams to stay updated on performance.

How Power BI Handles Real-Time Data

Power BI also supports real-time data processing, allowing marketers to access up-to-date insights. The platform can be configured to refresh dashboards so users can monitor up-to-date campaign performance. This capability is particularly beneficial for monitoring ongoing campaigns and making immediate adjustments based on performance metrics. Power BI’s dashboards can be configured to refresh at specified intervals, ensuring that users always have access to the latest information.

User Interface and Experience:
Which Is More Accessible?

Navigating Looker Studio

Looker Studio offers a streamlined and intuitive user interface. Its design is tailored for users who may not have extensive technical backgrounds. Key features include:

  • Drag-and-Drop Functionality: Users can easily create visualizations by dragging data elements into the report.
  • Prebuilt Templates: Looker Studio provides numerous templates for quick setup, helping marketers jumpstart their reporting efforts.
  • Simple Navigation: The platform's layout allows for straightforward access to various data connectors and dashboard features.

This simplicity makes Looker Studio a favorable choice for marketers looking to quickly generate insights without deep technical skills.

Navigating Power BI

Power BI’s interface is robust, catering to both novice users and experienced analysts. It features a ribbon-style menu that provides access to various tools and functionalities. Users can customize their workspace to suit their preferences, making it easier to navigate through complex datasets. Additionally, Power BI offers tutorials and guided learning paths to help users become proficient in using the platform.

Collaboration Features: Enhancing
Teamwork in Marketing Reporting

Collaboration in Looker Studio

Looker Studio provides several collaborative features tailored for marketing teams. Its sharing capabilities allow users to easily grant access to reports and dashboards, facilitating real-time collaboration. Users can comment directly on specific data points, enabling discussions that are contextually relevant. This feature helps teams align their strategies based on data-driven insights.

Additionally, Looker Studio's connection to Google products enhances collaboration, making it easy for marketing teams to share reports and keep stakeholders updated. For example, imagine a marketing team preparing for a campaign launch; they can collaborate in Looker Studio to analyze the latest performance metrics and adjust their strategies accordingly.

Collaboration in Power BI

Power BI also excels in collaboration, offering features that cater to marketing professionals. Users can create workspaces where team members can collaborate on datasets and reports. This functionality supports version control, ensuring that everyone is working with the latest information. Moreover, Power BI integrates with other Microsoft tools, making it easy to bring data insights into existing workflows.

One notable feature of Power BI is the commenting function, which enables users to leave feedback directly on the reports. This promotes dialogue about specific insights and findings. For example, as a marketing team analyzes results from various ad campaigns, team members can comment on the effectiveness of different strategies, fostering a collaborative environment focused on continuous improvement.

Best Practices for Using Looker
Studio and Power BI in Marketing

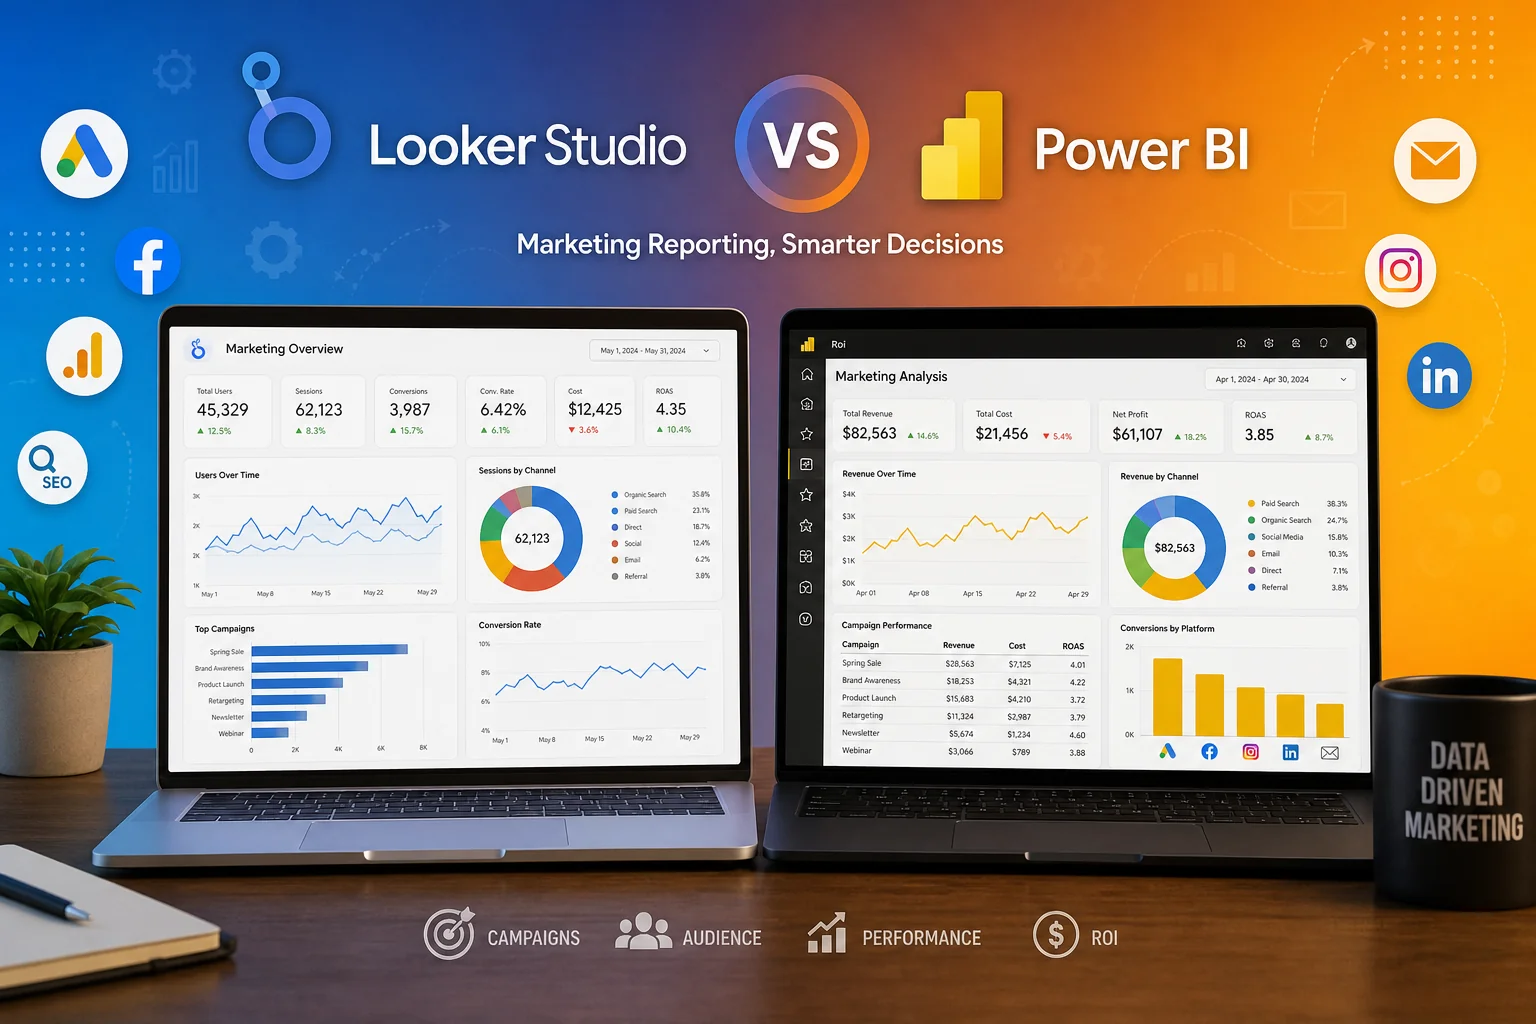
A vibrant marketing workspace with dual screens: Looker Studio's data visuals and Power BI's dashboard, surrounded by creativ

Tips for Optimizing Looker Studio

  1. Leverage Data Connectors: Looker Studio offers a variety of data connectors. Ensure you connect to all relevant data sources, such as Google Ads and your CRM, to get a holistic view of your marketing performance.
  2. Utilize Explores Effectively: Use the "Explores" feature to drill down into specific metrics. This allows for a deeper understanding of campaign performance and audience behavior. For example, imagine exploring the conversion rates for different demographics to tailor your ad strategies.
  3. Focus on Visualization: Customize your dashboards with meaningful visuals. Use charts and graphs that highlight key performance indicators (KPIs) and trends. This makes it easier for your team to spot opportunities and challenges quickly.
  4. Implement Real-Time Reporting: Set up real-time reporting to monitor your marketing efforts. This enables immediate adjustments to campaigns based on live data, ensuring you stay agile in your marketing strategy.
  5. Encourage Collaboration: Use sharing features to collaborate with your team. Share dashboards and insights, so everyone is aligned and can contribute to data-driven decision-making.

Tips for Optimizing Power BI

  1. Create Dynamic Dashboards: Power BI allows for interactive dashboards. Incorporate slicers and filters to enable users to customize their views based on specific parameters, such as time periods or campaign types.
  2. Utilize Power Query: Familiarize yourself with Power Query for data manipulation. This tool helps in preparing and cleaning your data before analysis, ensuring accuracy in your marketing reports.
  3. Leverage AI Insights: Take advantage of Power BI’s AI features. These tools can provide predictive analytics, helping you forecast trends and adjust your marketing strategies proactively.
  4. Maintain Consistent Data Sources: Ensure that your datasets are regularly updated and consistent. This will prevent discrepancies in reporting and provide a clear picture of your marketing performance.
  5. Collaborate with Microsoft Teams: Use Power BI’s integration with Microsoft Teams to enhance collaboration. Share insights and reports directly within your team’s communication channels for seamless discussions.

Common Misconceptions in Looker
Studio vs Power BI Marketing

Cost-Related Misconceptions

One prevalent myth is that one platform is significantly cheaper than the other. However, pricing structures for Looker Studio and Power BI can vary widely based on several factors:

  • Licensing Fees: Power BI pricing can vary depending on the plan and the number of users. Looker Studio offers a free tier, though costs may still arise from data sources or advanced features.
  • Total Cost of Ownership: When calculating expenses, it’s essential to consider additional charges, such as data integrations and the required infrastructure for each tool.

Complexity Misconceptions

Another common misconception is that Power BI is inherently more complex than Looker Studio. While Power BI does offer advanced features that may require a learning curve, it also provides extensive resources and support to help users navigate its functionalities. Conversely, Looker Studio’s simplicity does not mean it lacks depth; it offers powerful capabilities that can meet sophisticated reporting needs.

Conclusion

Digital illustration comparing Looker Studio's user-friendly dashboard with Power BI's advanced analytics interface, highligh

In summary, comparing looker studio vs power bi marketing reveals significant differences that can influence your reporting choices. Looker Studio shines in user-friendly dashboards and seamless Google data connections, while Power BI stands out with its broad data integration and advanced analytics capabilities. Understanding these strengths can help you select the best fit for your marketing needs.

As you consider your options, think about what features are most critical for your team. Start by evaluating your current data sources and reporting requirements to make an informed decision.

Questions
Answered

Common questions related to this topic.

What is Looker Studio vs Power BI marketing?

Looker Studio and Power BI are both powerful business intelligence tools used for marketing reporting. Looker Studio excels in creating visually appealing dashboards and integrates seamlessly with Google products, while Power BI offers robust data manipulation capabilities and strong integration with Microsoft tools.

How does Looker Studio vs Power BI marketing work?

Both tools enable marketers to visualize data effectively. Looker Studio uses a more straightforward interface for quick insights, while Power BI allows for detailed data analysis and complex reporting. This flexibility helps marketers derive actionable insights from their data.

Why should marketers choose between Looker Studio and Power BI?

Choosing between Looker Studio and Power BI depends on specific marketing needs. If real-time data visualization and easy sharing are priorities, Looker Studio might be better. On the other hand, if advanced analytics and integration with Microsoft services are essential, Power BI could be the preferred choice.

Can Looker Studio and Power BI handle real-time data processing?

Yes, both Looker Studio and Power BI can process data in real-time. Looker Studio connects easily with various Google services for immediate updates, while Power BI leverages its integration capabilities to provide real-time insights from multiple data sources, enhancing decision-making.

Should I use Looker Studio or Power BI for data integration?

For data integration, both platforms are strong contenders. Looker Studio offers streamlined connections to Google services, making it ideal for marketers using Google Ads. Meanwhile, Power BI provides a wider range of data source integrations, which can be beneficial for those utilizing diverse marketing tools.

What are the collaboration features in Looker Studio vs Power BI marketing?

Both tools offer collaboration features that enhance teamwork. Looker Studio allows for easy sharing of dashboards with stakeholders, while Power BI provides robust features for team collaboration, including shared workspaces and comments on reports, which can streamline communication and improve project outcomes.

Free Strategy Call

Ready To GrowThis Into Results?

Explore Looker Studio vs Power BI marketing tools for data reporting. Discover which platform best suits your needs.

✓Opportunity Assessment
✓Channel Review
✓Growth Recommendations
✓No Obligation
OR

Prefer to reach out directly? We'll get back to you as soon as possible.

Contact MASS DATA Today
Scroll to Top